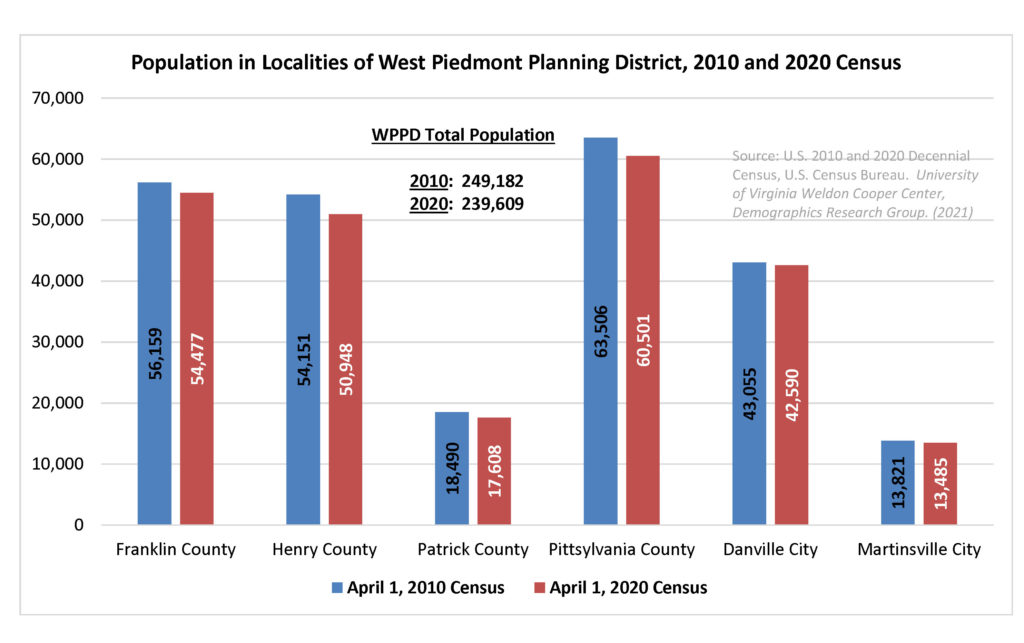
On August 12, the U.S. Census Bureau Released redistricting population data for each of the localities in the U.S., which includes total population data. The data show that the population of the West Piedmont Planning District declined since the 2010 Census, dropping from 249,182 on April 1, 2010 to 239,609 on April 1, 2020. The population changes for each locality in the West Piedmont Planning District are as follows:
-
-
- Franklin County’s population declined from 56,159 to 54,477, a decline of 3.0%.
- Henry County’s population declined from 54,151 to 50,948, a decline of 5.9%.
- Patrick County’s population declined from 18,490 to 17,608, a decline of 4.8%.
- Pittsylvania County’s population declined from 63,506 to 60,501, a decline of 4.7%.
- Danville’s population declined from 43,005 to 42,590, a decline of 1.0%.
- Martinsville’s population declined from 13,821 to 13,485, a decline of 2.4%.
- The population of the West Piedmont Planning District declined from 249,182 to 239,609, or 3.8%.
- The population of Virginia increased from 8,001,024 to 8,631,393, an increase of 7.9%.
-
One interesting observation is that, while each of the counties and cities experienced declines in population between the 2010 and 2020 Census, the population decline in the cities, in terms of percentage, was less than that for the counties. In the case of Danville, the River District has attracted significant growth over the past decade, likely stemming some of the city-wide decrease.

The table below, entitled “2010 and 2020 Populations of Towns in the West Piedmont Planning District” shows an interesting trend compared to the population changes for the counties and two cities within the West Piedmont Planning District. While two of the towns, Chatham and Hurt, lost population over this period, the majority experienced population increases, though modest. Another observation is that the two towns that did experience population declines did so by only several dozen people each. A tentative conclusion that could be drawn is that perhaps residents of the West Piedmont Planning District have a preference for living in towns rather than in rural areas of counties or in cities.

The following table, entitled “Race Trends in the West Piedmont Planning District, 2010 and 2020,” indicates trends of various racial groups in the West Piedmont Planning District, based on 2010 and 2020 Decennial Census data. The graph shows that the share of the White population declined slightly over this period, while the Black/African-American population increased slightly. The graph also shows that the other three racial groups analyzed – Asian or Pacific Islander, American Indian or Alaska Native, and Other – both increased in share in the Region over this time period.

The following table, entitled “2020 Census Count by Hispanic Origin (Virginia Localities),” shows the number and percentage change of the Hispanic population in the West Piedmont Planning District and its constituent localities from 2010 to 2020. The table shows that each locality’s share of the Hispanic population increased during this period, with Danville and Martinsville – particularly Martinsville – experiencing higher increases in share than the counties.

